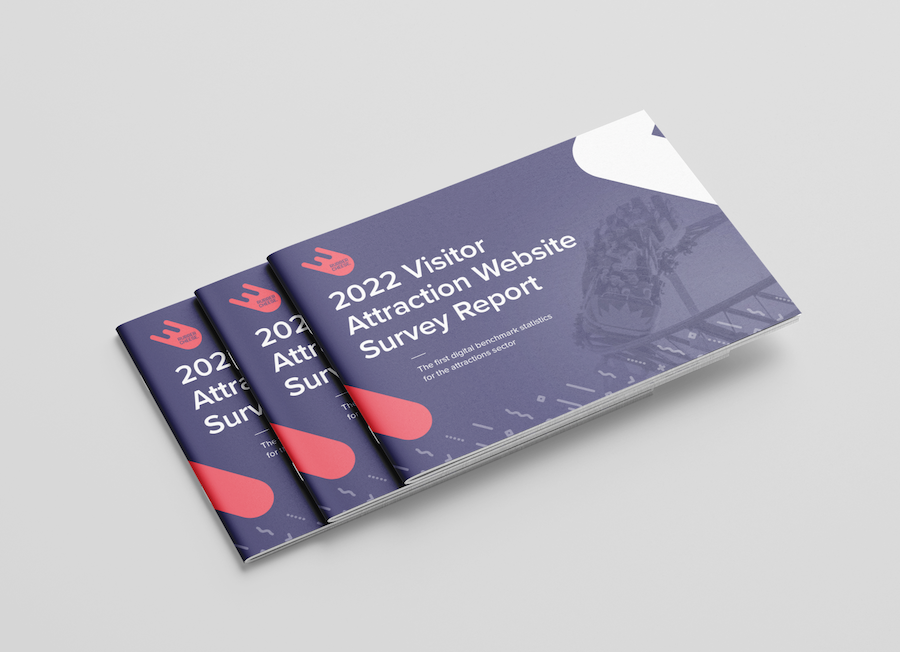
How can you benchmark your visitor attraction website against national averages?
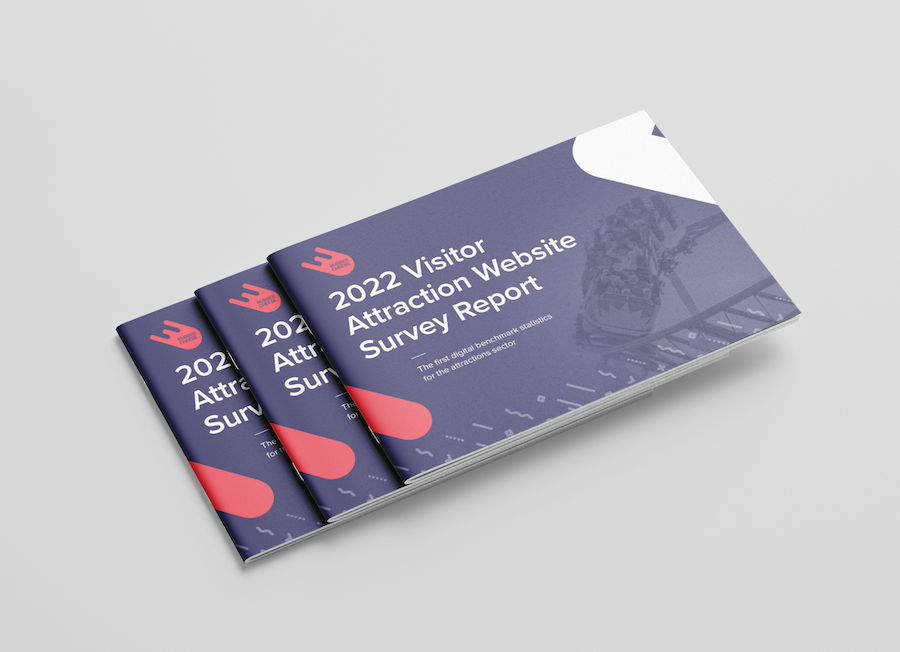
For the first time ever, benchmarks related specifically to websites in the visitor attraction sector have been established by Rubber Cheese.
This means marketing professionals within the industry now have a more accurate picture of what good looks like across similar branded websites, allowing for better decision making with genuine insight.
Findings presented in the report reveal metrics for:
- Add to basket rate
- Basket abandonment rate
- Bounce rate
- Conversion rate
- Load times
Plus key insights into user experience, booking journeys, mobile experience and more.
Carried out with the full support of the ALVA, Leading Association of Visitor Attractions and ASVA: Association of Scottish Visitor Attractions, this report brings you vital information and suggests practical solutions to the problems identified. So that you can concentrate on running a successful attraction, and let your website run itself!
“The past few years have transformed how visitor attractions operate online forever. With the increased need for online bookings, additional revenue drivers, and a seamless on and offline experience, it’s more important than ever for visitor attraction marketers to understand how their website is performing.
But knowing what good looks like is almost impossible until we uncouple visitor attractions from the travel and tourism industry sector skewing the data. After all, an airline is not a comparable business to a theme park or museum.
We realised that there has not been a focus on visitor attractions as a sector in its own right before, hence, this year’s Rubber Cheese Annual Visitor Attraction Website Report. We’re using this as the starting point, a springboard, to a deeper understanding of how to achieve the highest possible conversion rates within the visitor attraction sector.
This first of its kind piece of research looks only at websites related to visitor attractions of all types, but removes data related to price comparison sites for airlines and hotels. We’re generating meaningful insight for a visitor attraction category all of its own!
And this refined data did NOT disappoint! The results have proved to be very exciting”.
Kelly Molson, Founder Rubber Cheese
Methodology
A voluntary online survey was conducted over the 3 months from June to August 2022. Questions were both quantitative and qualitative and selected with the aim to provide deeper insight into the performance of the website.
Respondents were encouraged to take part through a combination of marketing activities from Rubber Cheese and through the promotion of the survey via ALVA and ASVA to their member bodies. All data has been analysed by a third party to ensure clarity and transparency, and to identify key trends and patterns.
Key Insight
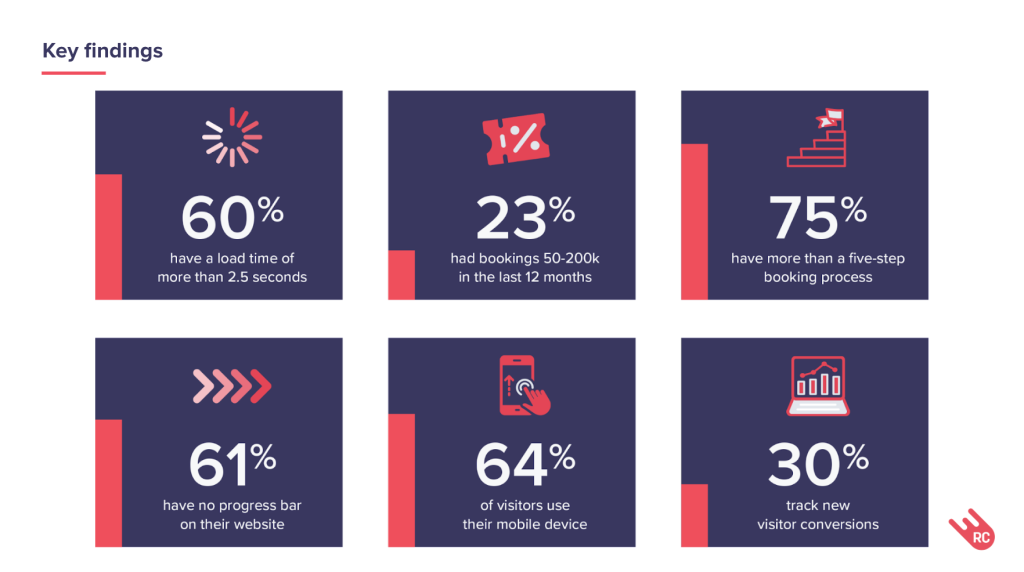
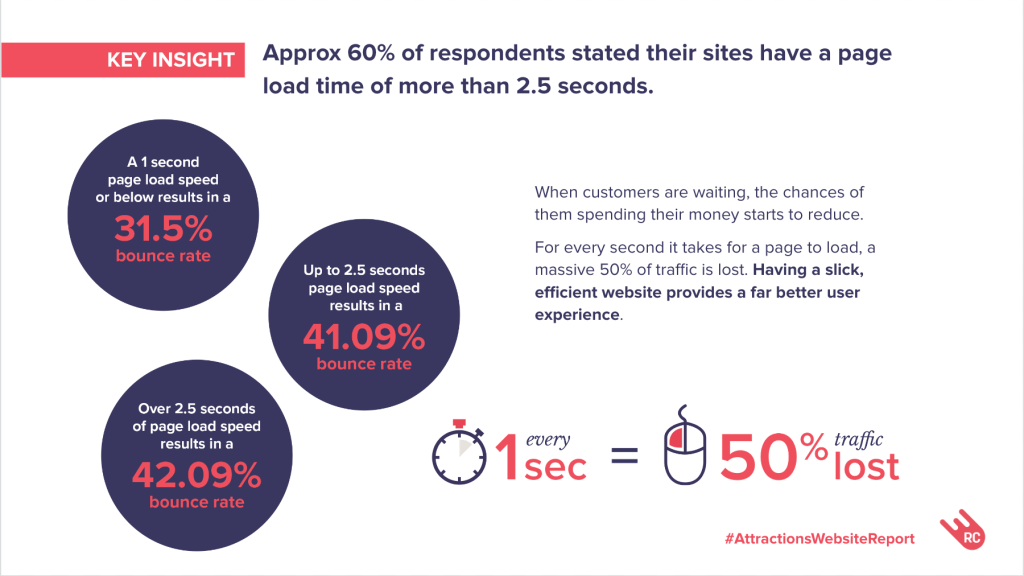
One key insight was that around 60% of respondents said their sites have a page load time of more than 2.5 seconds. Also, 75% of respondents stated there are more than five steps in their booking process before the completion of a purchase.
Launch event
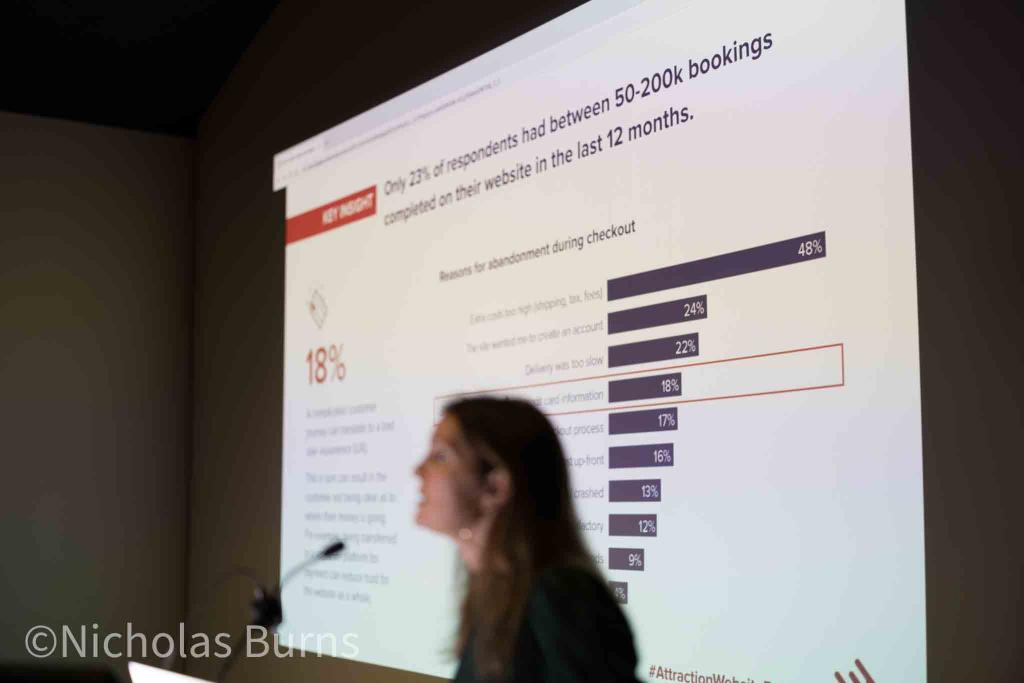
Rubber Cheese founder Kelly Molson presented key findings from the report to an audience of over 70 attraction professionals from across the sector, at the London Transport Museum on Tuesday 15th November. The event was sponsored by Convious.
Feedback on the report has been overwhelmingly positive.
"This new research by Kelly and the team at Rubber Cheese is such a valuable insight into much needed key information. Previously figures were unpredictable to benchmark against as visitor attractions were rolled in with the Travel and Tourism Industry.
As an attraction currently looking to re-evaluate our own website over the next year, the findings give us real specific data to now consider in our planning for the future. It highlights the importance of that streamlined, optimised digital experience for busy visitors before they even arrive, to ensure a seamless journey which inevitably will result in better conversion rates for attractions overall.
We look forward to the team building on these initial findings annually to inform the sector more specifically.”
Laura Cottrell - Sandringham Estate
Natalie Douglas, Head of Marketing at Pensthorpe adds:
“In the current climate where consumers are tightening the purse strings and making every penny count, it’s more crucial than ever for attractions to impress their potential visitors before they’ve even arrived at the gates.
“The report outlines how important it is to ensure the user journey begins from the moment the visitor lands on your website and that this directly translates to footfall. Understanding the importance of simple fixes that can be done to your website to ensure that it’s a user-friendly experience is vital. Importantly, mobile-friendly websites are crucial in today’s market – as consumers are booking days out either the day before or even on the day of their visits. If the experience of booking is in any way difficult – the bottom line is you’ve lost them before they arrive.
“Reports from businesses like Rubber Cheese really help attractions understand their customers’ needs on a deeper level and identify how important the digital landscape is to business success. Solutions that increase consumers’ confidence when purchasing are something that will keep them coming back for more and sets a business apart from its competition.”
To download the full report, please click here.
Can we help you with your attraction website?
Rubber Cheese we design and build remarkable websites that help sell more tickets and showcase outstanding visitor attraction experiences.
Taking a user centric approach, we focus on making continual improvements that deliver better conversions and increased revenue. We can support your existing WordPress or Umbraco website, or work with you to create a new one.
